High Theoretical Loading Rate, Low Execution Reality: Why Loading Plans Fail On-Site
1. Scenario and Core Problem
The dashboard flashes green. Ninety-three percent volume utilization. Eighty-nine percent weight distribution. The algorithmic solver has completed its mathematical optimization routine. A planner, operating under standard throughput pressure, proceeds to carry out the authorization procedure upon the digital manifest.
Then the physical reality sets in.
At the loading dock, execution grinds to a halt.
Heavy steel coils are mathematically positioned behind lightweight polymer pallets, creating an immediate retrieval blockade. Narrow spatial corridors completely eliminate the necessary swing radius for standard clamp trucks. Workers find themselves forced to partially dismantle the forward half of the container just to extract a priority SKU resting near the rear bulkhead. The digital blueprint achieves theoretical density. The floor operations collapse under the weight of spatial friction. You watch the timeline stretch. Repacking begins. Cargo takes damage. The schedule bleeds hours that the solver simply does not track.
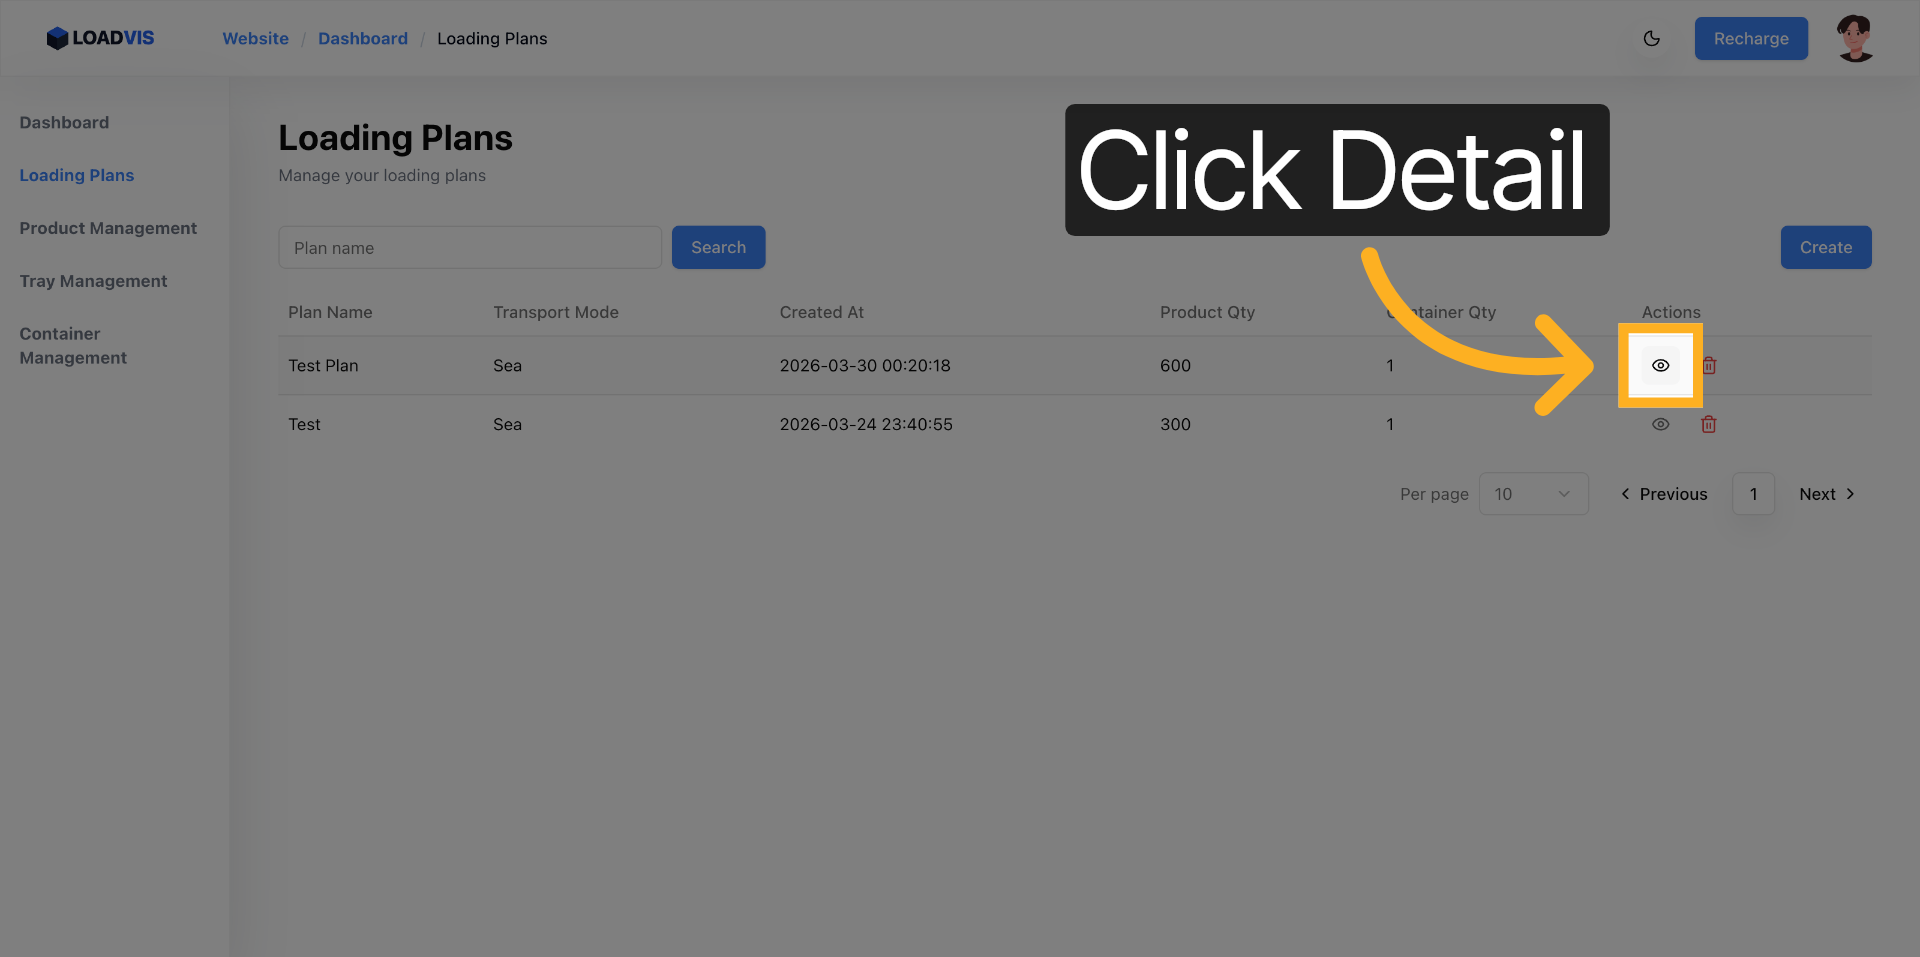 Navigate to the plan detail interface to observe the initial calculation output and spatial configuration.
2. Why This Problem Is Systematically Underestimated
Engineering teams frequently fall into a geometric trap. They proceed to treat algorithmic outputs as static spatial puzzles that reach completion once the percentage metrics cross a green threshold. The fundamental oversight resides in the conflation of inert volume fitting with dynamic mechanical execution. Loading constitutes a strictly temporal process. Once a physical layer is deposited, it permanently occludes access to the spatial envelope behind it.
We routinely observe workflow patterns where planners direct their entire focus toward the reduction of cost-per-cubic-meter optimization targets. They routinely skip sequence validation. Traditional two-dimensional cargo manifests flatten three-dimensional operational reality into a deceptive grid. A standard spreadsheet lacks the capacity to reveal occluded access pathways. It cannot calculate real-time centroid migration during highway transit. It completely ignores how corrugated box inflation reduces the effective door clearance by millimeters that compound into centimeters. The pervasive organizational assumption that site personnel will simply adapt to the digital plan completely disregards standardized equipment limitations. It also bypasses mandatory handling safety thresholds.
When things go wrong, they go wrong here. The solver assumes frictionless physics. The dock does not.
3. Key Validation Operations and Their Operational Weight
To prevent theoretical density from sabotaging physical throughput, you must engage in a rigorous pre-dispatch stress testing workflow. The following diagnostic actions carry disproportionate weight in the operational pipeline.
Interrogating the Unloaded Cargo List Immediately following the calculation engine's termination, you must proceed to direct your attention toward the exclusion panel. Treat this interface not as a simple rejection log, but as a primary diagnostic instrument. It precisely maps which spatial boundaries or weight distribution constraints forced the solver into a compromise state. When priority goods or entire logical groupings materialize in this exclusion list, you are witnessing a hard boundary violation. The required response involves carrying out a manual adjustment of the plan parameters rather than casually swapping container profiles.
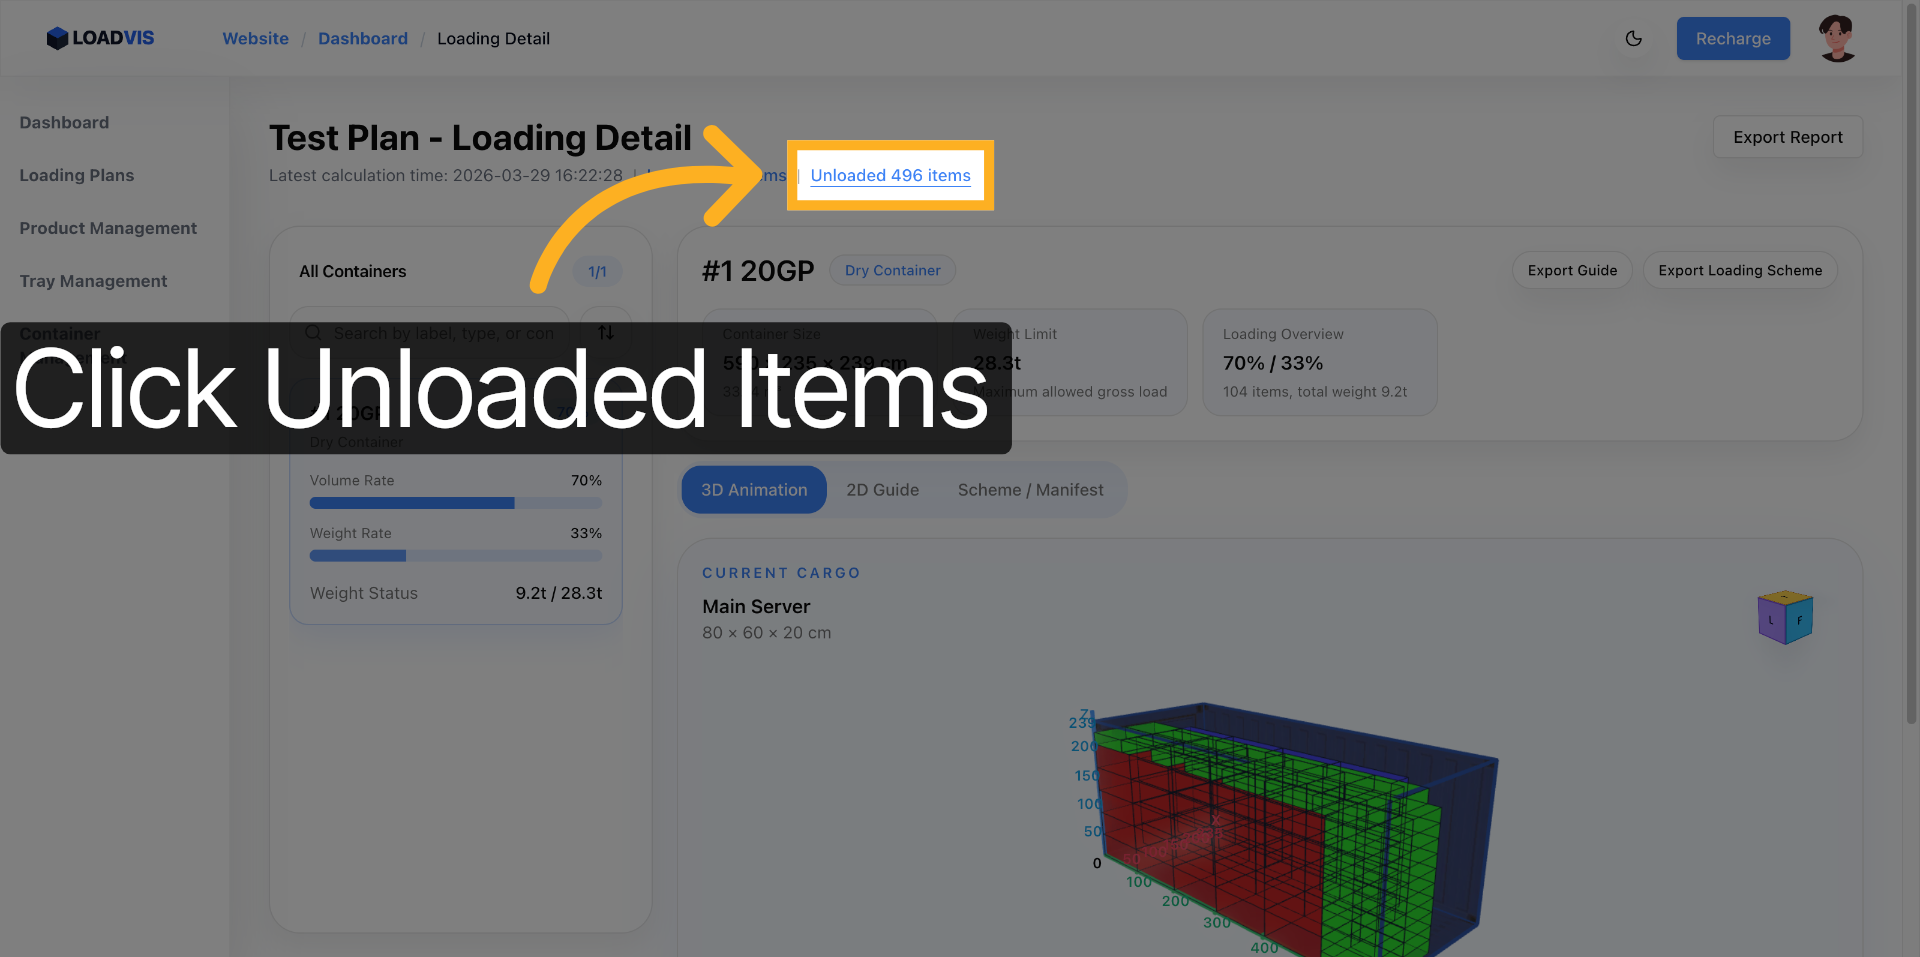 Initiate the expansion procedure upon the unloaded summary module and proceed to conduct an examination of grouping constraints.
Simulating Loading Sequence via 3D Animation You need to initiate the playback sequence within the three-dimensional visualization module. This process chronologically reconstructs the placement timeline. Watching the visualization at an accelerated playback velocity allows for the rapid scanning of underlying structural logic. If the temporal sequence demonstrates a large base unit being deposited late in the cycle, or if lighter items are positioned forward of heavier cargo blocks, the plan assumes physical impossibility. Real loading operations proceed strictly in a forward-to-rear or bottom-to-top sequence. Visualizing this process exposes hidden mechanical bottlenecks before tires ever touch concrete.
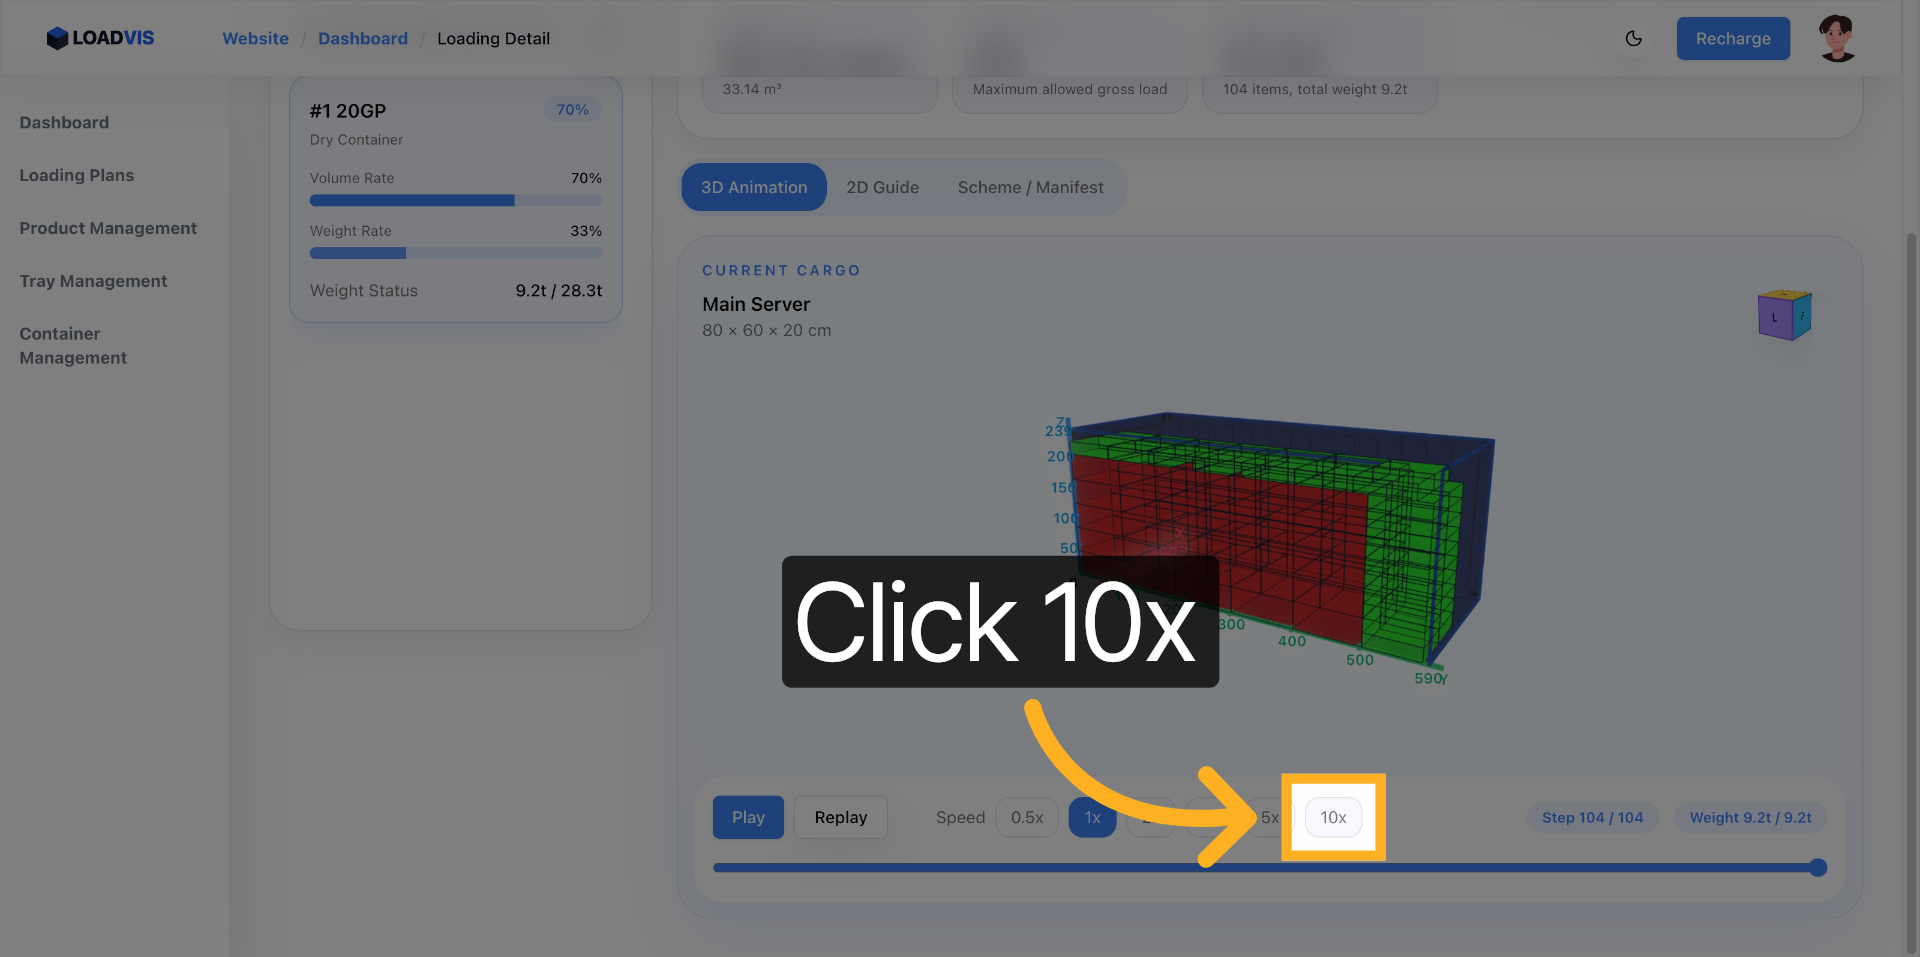 Utilize the acceleration controls to modify the playback rate and observe the full temporal sequence.
Switching to 2D Guide View for Spatial Audits The planar perspective deliberately removes depth distortion. This topological flattening exposes exact cargo footprints, door clearance margins, and grouping dead zones. You must carry out a cross-referencing procedure between this two-dimensional guide and your master cargo manifest. This step ensures that the dimensional parameters and weight data align perfectly with your actual handling equipment specifications. You are actively verifying that the theoretical digital boxes correspond directly with the physical handling limits of your yard machinery.
 Activate the planar overlay mode to conduct precise clearance verification against known equipment dimensions.
4. Wrong Approach vs. Reliable Approach
The Flawed Pathway Signing off on a dispatch directive based exclusively on the volume and weight summary percentages constitutes a fundamental procedural error. Proceeding to export an Excel scheme and blindly forwarding it toward the warehouse floor without performing spatial logic validation guarantees operational failure. This behavior treats the computational solver’s mathematical output as an immutable physical mandate. It ignores geometric realities. Rework becomes inevitable.
The More Reliable Pathway Approach the initial calculation result as nothing more than a preliminary draft proposal. Following the completion of the algorithmic routine, open the Unloaded list first to comprehend the constraint trade-offs the engine was forced to negotiate. Run the three-dimensional animation sequence to rigorously verify that the generated temporal order matches your actual dock workflow constraints. Utilize the two-dimensional spatial guide to physically measure clearances against known forklift chassis widths and minimum turning radii. Only after you have visually resolved all spatial conflicts and manually authorized the arrangement should you proceed to modify product grouping parameters, adjust spacing buffers, or execute container profile substitutions.
5. Tool Boundaries: Automation Limits vs. Manual Confirmation
Automation excels at geometry. It struggles with institutional nuance.
How Far the Platform Extends The computational environment successfully carries out the automation of highly complex multi-SKU geometric packing routines within strictly defined mathematical boundaries. It instantly generates flag notifications for constraint violations. It constructs frame-accurate temporal loading sequences. It provides multi-perspective spatial verification layers and standardizes raw dimensional data into consistent manifests. The platform successfully eliminates guesswork regarding packing density. It actively prevents the silent constraint breaches that traditional manual spreadsheet planning routinely overlooks.
 Engage in a thorough examination process of the cargo specification manifest to validate physical parameters.
Which Steps Demand Manual Intervention The calculation engine does not possess knowledge of your specific loading dock’s physical infrastructure obstructions. It cannot model the exact mast clearance specifications of your aged forklift fleet. It certainly cannot factor in the variable skill levels of your loading crew. You retain full responsibility for carrying out the manual confirmation process on several critical fronts. First, you must verify that the programmed inflation values accurately reflect real-world packaging material swelling or pallet board overhang. Second, you need to judge whether the calculated centroid offset aligns safely with your transport vehicle’s suspension geometry and axle load limits. Third, you must actively decide the operational trade-offs involved when accepting a three to five percent utilization degradation preserves a critical unloading aisle. Fourth, you are obligated to ensure that the master data repository—including maximum stacking limits and weight-bearing flags—perfectly matches the current physical inventory reality.
6. Summary
A loading plan achieves true viability only when spatial density maintains perfect alignment with physical execution capability. High utilization metrics that lack rigorous sequence and accessibility validation do not generate efficiency gains. They manufacture operational bottlenecks. You must utilize simulation logs and spatial guide overlays to actively stress-test your planning configurations inside a digital workspace long before physical units ever approach the loading bay doors. Optimize your parameters for real-world mechanical handling. Ignore the vanity of dashboard percentages when they contradict physical law.